To understand the current state of the marketing funnel, GetResponse and Demand Metric partnered to research how much friction is in today’s marketing funnel, and where it most commonly appears.
Marketing Funnel Friction Benchmark Report
Resource Overview
Related Resources


Introduction
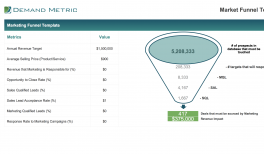
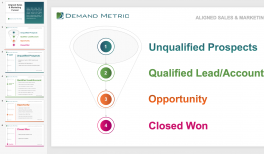
Marketers invest significant time and money to build funnels that attract, nurture, qualify, and convert leads to customers. In most organizations, the funnel is the object of continuous efforts to manage and improve its performance, always tuning it to produce higher conversion rates.
Marketers aspire to have a funnel that is a well-oiled machine, highly automated with ample leads flowing smoothly from top to bottom.
The reality, however, is that few marketers have funnels that perform flawlessly even some of the time. There is almost always some “friction” in the funnel that impedes the ability of leads to flow from one section to another.
For many marketing organizations, it’s common to have one section of the funnel that works well while another section is problematic. Marketers find themselves applying time, effort, technology, and resources to address “hot spots” in their funnels.
Once addressed, the hot spots rarely go away completely; they just relo- cate to a different part of the funnel.
To understand the current state of the marketing funnel, GetResponse and Demand Metric partnered to research how much friction is in today’s marketing funnel, and where it most commonly appears. Using a survey, the study measured, by funnel section, the tactics marketers are using, how well they are working, where friction exists and why, and the degree to which automation reduces or eliminates this friction.
This report shares the research results and insights to help marketers achieve better performing funnels.
Table of Contents
- Introduction
- Executive Summary
- Today’s Marketing Funnel
- Marketing Tactics Usage & Performance
- Impact of Funnel Automation
- The Bottom Line on Funnel Friction
- Acknowledgements
- Appendix - Survey Background
Research Methodology
This 2019 Funnel Friction Benchmark Study survey was administered online during the period of June 2 through July 5, 2019. During this period, 284 responses were collected, 264 of which were qualified and complete enough for inclusion in the analysis. Only valid or correlated findings are shared in this report. The representativeness of this study’s results depends on the similarity of the sample to environments in which this survey data is used for comparison or guidance.
Resource Overview
To understand the current state of the marketing funnel, GetResponse and Demand Metric partnered to research how much friction is in today’s marketing funnel, and where it most commonly appears.
Work With Us!
Want to transition into consulting that pays $25K/DAY?